Built for R&D Teams

Research & Development.

From prototype to production. Spend your time on the science, not the spreadsheets.

University Labs Battery Startups Corporate R&D National Labs
Custom research dashboards
Battery cycle life graphing
10x faster
Stop wrestling with Excel.
Bring your own
Python SDK for your models.
Unlimited data
No GB limits on cycle data.
Read R&D insights

Features

Everything your research team needs.

Comprehensive tools to take your battery research from raw cycler data to publication ready insights.

Quick Graphing

One click data analysis.

Stop wrestling with Excel and complex Python scripts. Get instant, professional visualizations of your battery data with one click.

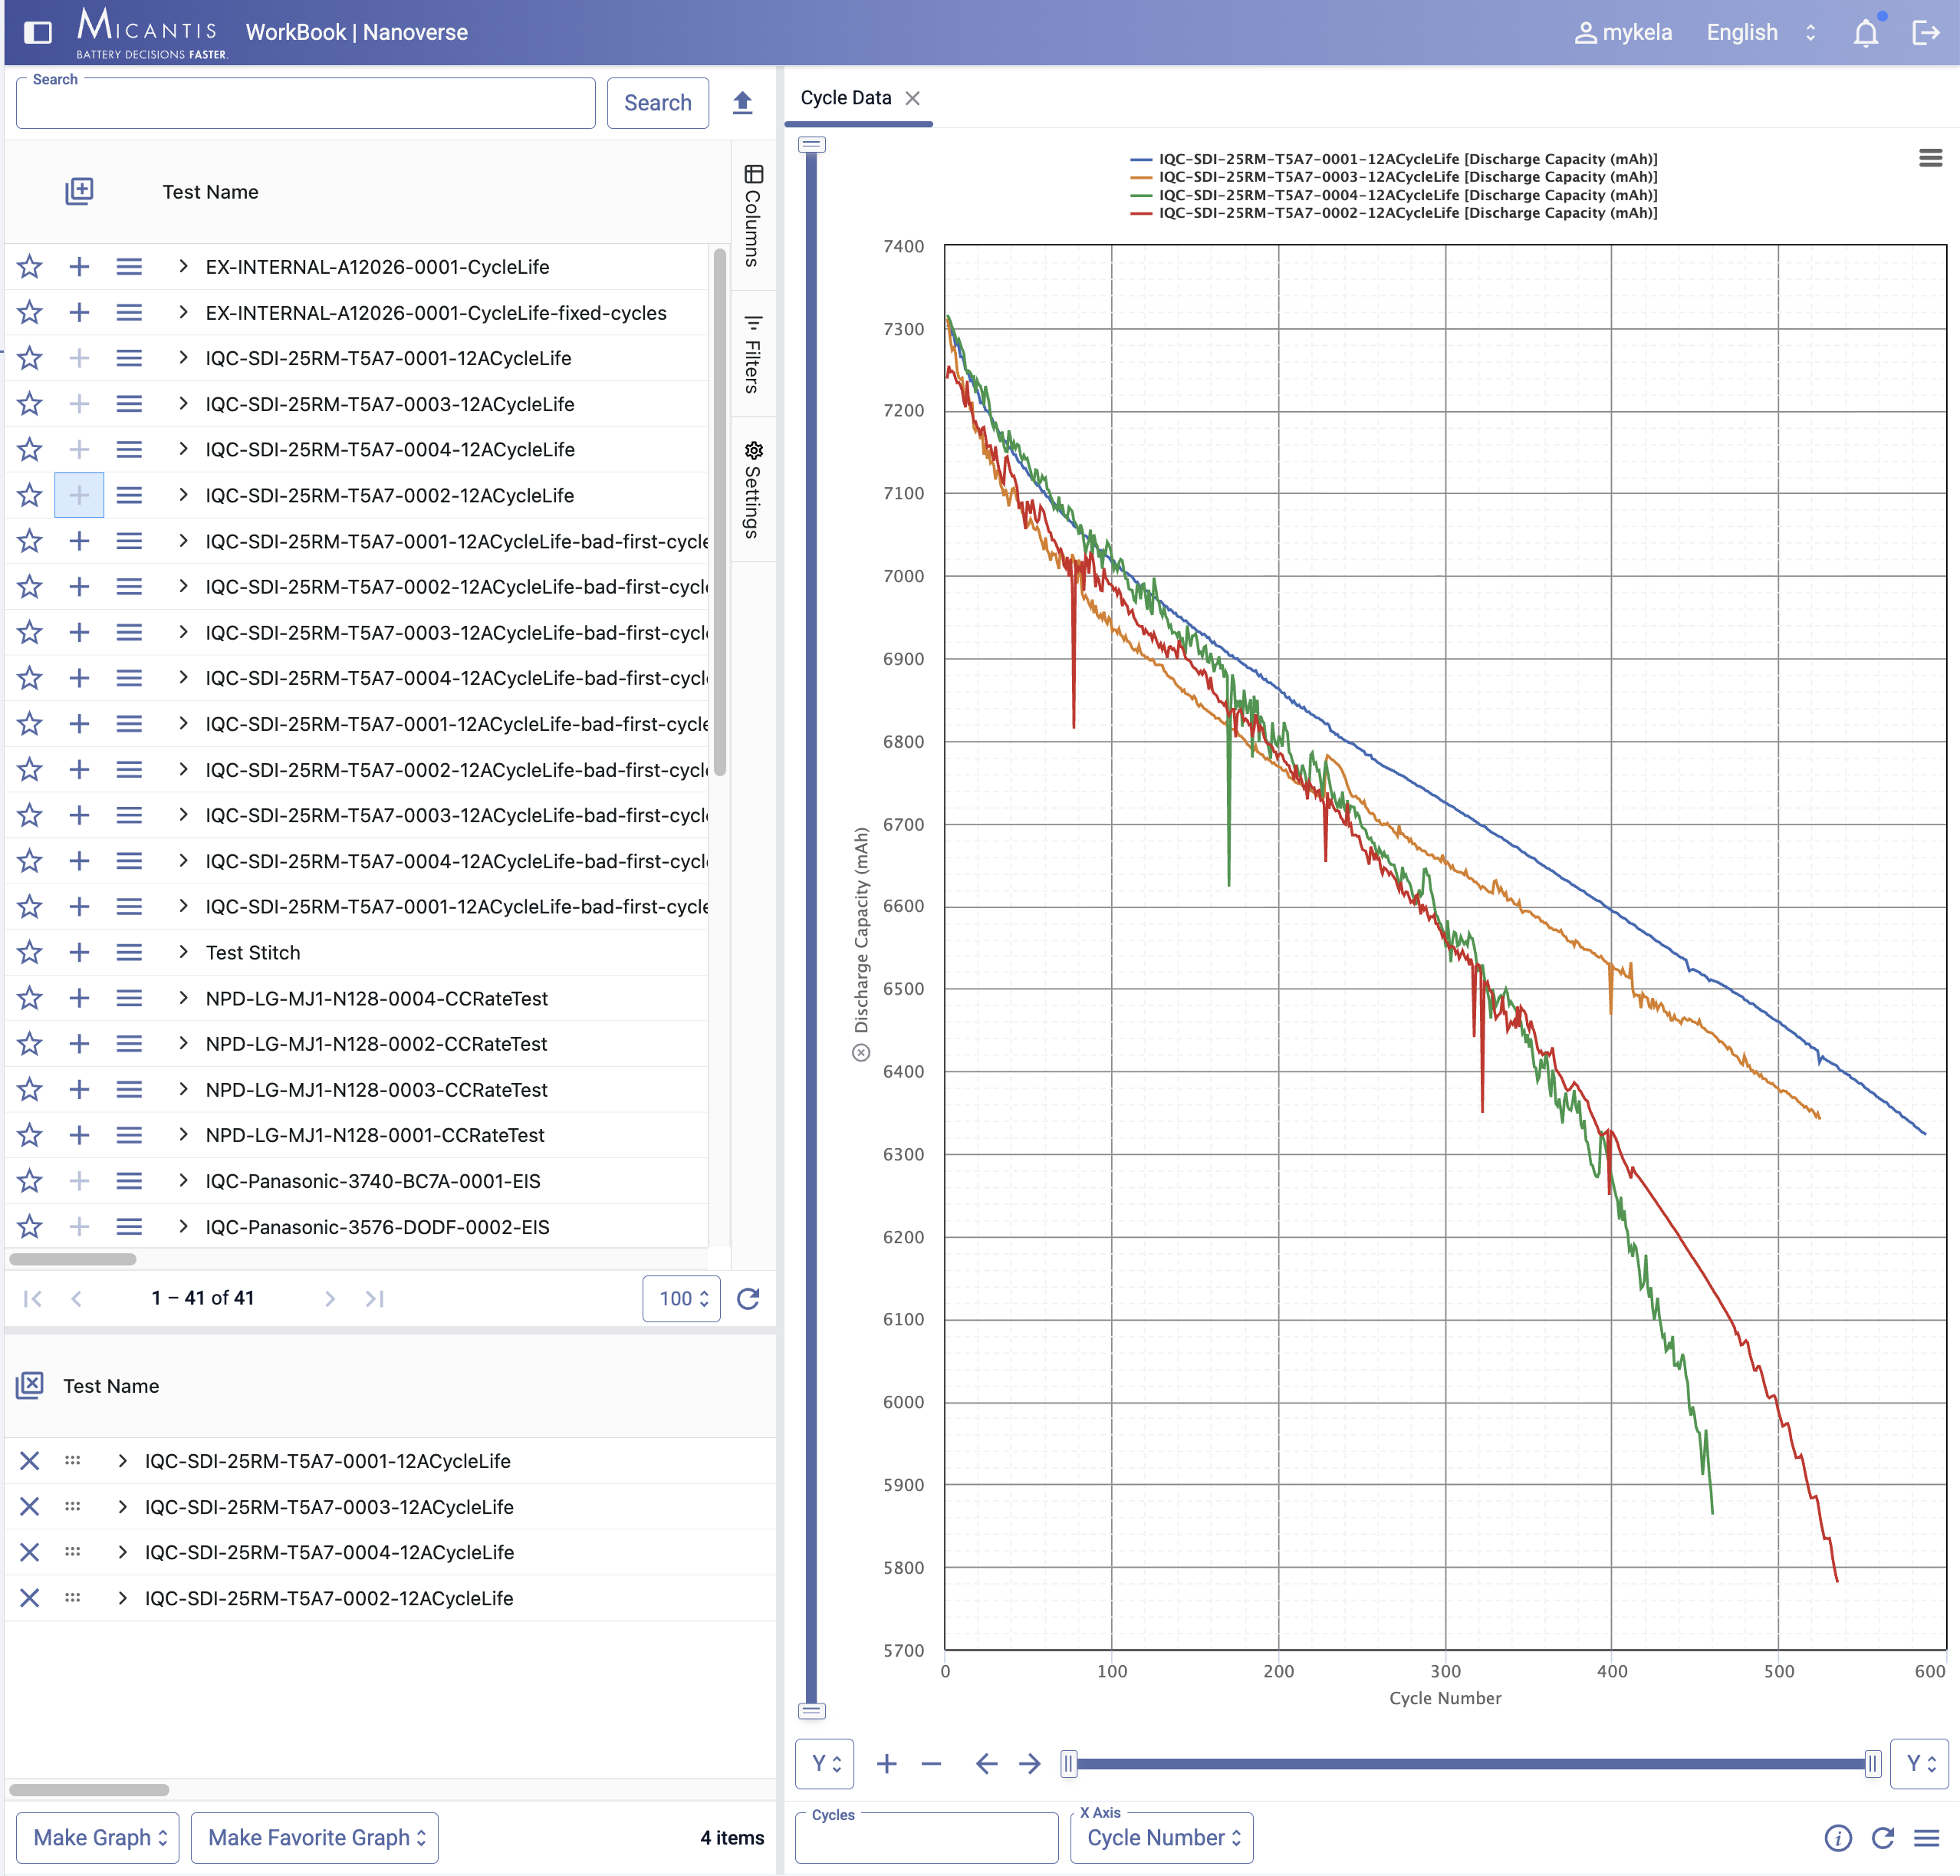
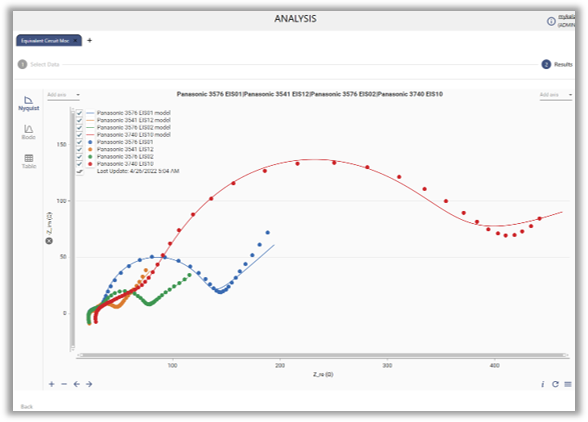
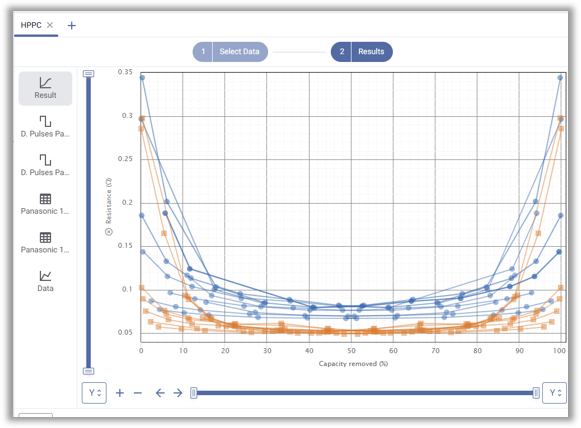
  • One click visualizations for voltage, capacity fade, dQ/dV, EIS Nyquist, DRT
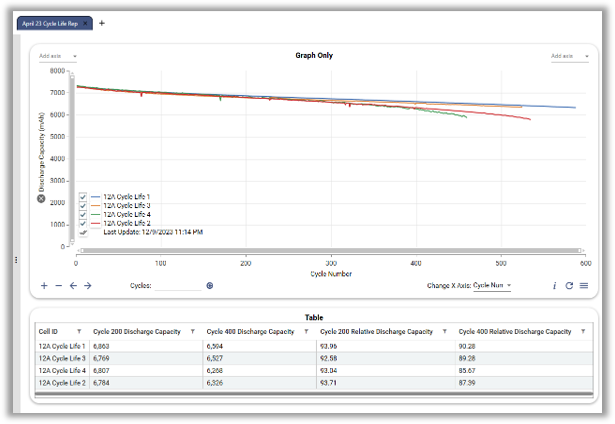
  • Multi cell comparisons across unlimited datasets
  • Interactive exploration with zoom, pan, and inspect
  • Presentation ready styling and smart annotations
Cycle life graphing in the Micantis Web App

Integrations

Works with your lab equipment.

Seamless data import from cyclers, potentiostats, and LIMS platforms.

Battery Cyclers

Data import from any cycler. If we don't support yours yet, we'll add it.

Arbin Maccor Neware Bitrode BioLogic Basytec

Potentiostats & EIS

Import EIS data and electrochemical measurements from leading instruments.

Gamry Autolab Ivium Solartron Princeton Squidstat

LIMS Systems

Connect lab data with sample tracking and metadata pipelines.

LabWare STARLIMS LabVantage Benchling Uncountable LabVIEW

Accelerate your battery research.

Join leading research institutions and companies using Micantis.