November 24, 2025 · 8 min read
Vibes versus Data: When to rely on intuition and when to rely on data
Introduction
Scaling from lab to pilot to commercial production is one of the hardest challenges for any commodity industry, from oil and gas to pharmaceuticals, and now batteries. The Western battery market faces this hurdle head-on as pressure and incentives mount to compete with China.
 At the same time, the world is being inundated with buzzwords like AI, ML, and process acceleration; the battery industry is no exception. In theory, these tools can dramatically accelerate the path to both innovation and scale-up. We now have more computing power and automation platforms than ever before. But none of it works without the most critical ingredient: good data. Good data is data that's complete, consistent, contextualized, and connected. Good data is the key competitive edge when looking to innovate and scale faster.
Despite this global shift towards data driven approaches, much battery development still relies on what I like to call 'vibe experimenting' — decisions guided by experience and intuition rather than evidence. I remember one time asking a consultant how they knew if the material was good or not before putting it into a battery. Their response? "Usually, technicians can tell by looking at the color" It was a half-joke but approaches like this are the essence of vibe experimentation.
What is "Vibe Experimentation"?
Vibe experimenting (or trial and error) is when scientists and engineers change ingredients, adjust formulations, and hope for success based on intuition and experience. This, of course, can be a successful approach, but it doesn't scale. In today's market where time, materials, and capital are all limited, progress depends on knowing when to rely on intuition and when to let data lead.
Vibes Can Be Good
Vibes-experiments (or intuition experiments) isn't all bad, and data driven approaches won't replace experienced engineers and scientists. Consider developing a brand new material where the design space is absolutely massive. For example, how do you know if you should vary chemistry or cell design first? This is where expertise and expertise-driven trial and error are crucial to guide initial experiments in the right direction.
When the scale is small and the experiments need to be dynamic, purely data driven approaches are not the way to go. The trouble with intuition comes when a material is validated and the team needs to transition from validation to scaling. What worked as rapid iteration in the lab can become inconsistent and expensive at production scale. This is the transition point where data becomes the extension of intuition. Once key variables are known, data helps quantify what intuition has revealed, showing which factors drive yield, stability, or performance drift. Instead of replacing intuition, data helps encode it, so lessons learned by one team can be applied predictably across sites, chemistries, or suppliers.
There is, of course, always a balance between data and intuition and researchers should always be using data to guide decisions. The question is, how much do you rely on data and how do you know how to balance intuition versus data?
💡 Exploration Phase
Vibes-Heavy
- New material development
- Small batches (< 50 cells)
- Exploring design space
- Rapid iteration needed
⚖️ Validation Phase
Balanced Approach
- Pilot scale testing
- 100-500 cells
- Testing key variables
- Building data systems
📊 Scale-Up Phase
Data-Heavy
- Production volume
- Multi-site operations
- Supplier management
- Quality at scale
The Transition to Data
At R&D and pilot scale, intuition-led iteration works. When testing 10-50 cells, an experienced engineer can spot anomalies, adjust parameters on the fly, and chase promising leads without formal data infrastructure. But as teams move toward production scale, this approach breaks down.
Inflection point signals:
- Moving from validation to production scale
- When inconsistency becomes expensive (multiple sites, suppliers, shifts)
- When tribal knowledge creates bottlenecks (only one person can interpret certain results)
- When testing volume reaches hundreds to thousands of cells per month
The battery industry isn't unique in facing this transition. Every manufacturing sector that scaled from small-batch to high-volume production hit the same wall. Western battery manufacturers are racing to catch up - and these case studies show what's possible when companies commit to data infrastructure at their inflection point:
Process improvements across industries through data-driven approaches. Hover over bars to see details and click to view sources.
Most of these case studies aren't battery companies...yet. But they faced identical challenges: scaling expert knowledge to production volume, managing quality across sites, reducing the cost of trial-and-error iterations. Toyota's 90% reduction in root-cause analysis time is exactly what happens when test data is properly structured and connected. The battery industry is at this same inflection point right now.
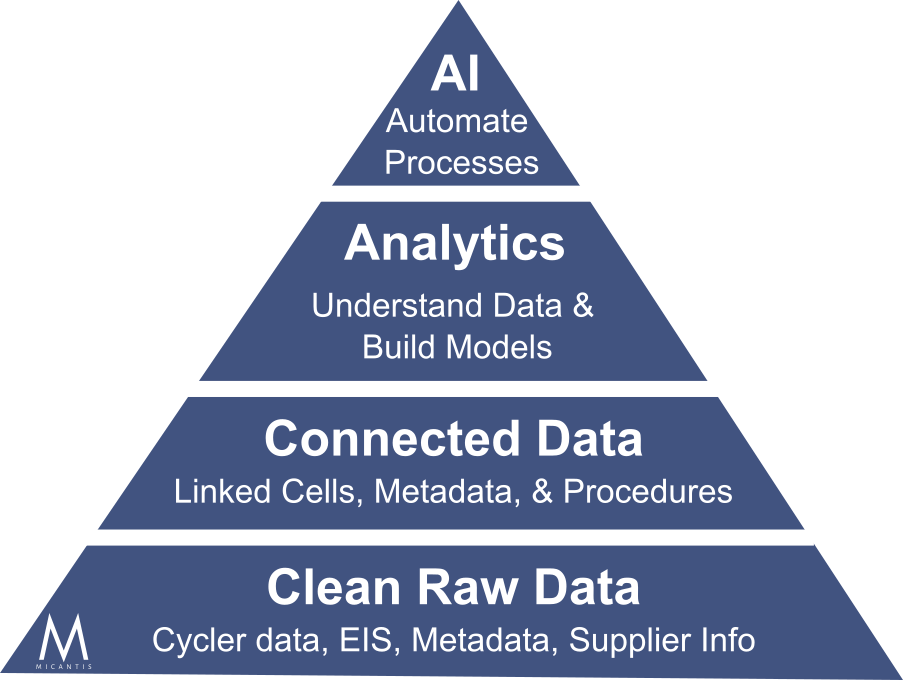
But before implementing advanced analytics or AI, organizations need to build the foundation shown in the data pyramid above. Start by auditing your current data: Is it clean, consistent, and accessible? Can you link cell performance back to materials, processes, and equipment? Most teams discover their data lives in silos - cycler files here, metadata spreadsheets there, tribal knowledge everywhere. The first step isn't buying AI tools; it's consolidating and standardizing your raw data so it can actually be analyzed. Only then can you move up the pyramid to connected data, analytics, and eventually AI-powered automation.
How to Become Data Driven
Data Collection
The Problem: For many battery teams, data collection starts with manual processes. A technician finishes a formation test, exports a CSV from the cycler, and saves it in a shared folder. Cell metadata lives in a separate spreadsheet. Supplier lot numbers might be in a notebook or email. Equipment calibration logs are in another system.
When someone needs to answer "which supplier batch was used for cells 100-150?" it often requires checking multiple sources.
The Goal: All data sources feed into one structured, accessible database. In practice, this means setting up automated data pulls from cyclers and characterization equipment, digitizing metadata entry, and creating standard templates. It's foundational work that enables everything that comes after.
In Lab
- Cell composition metadata
- Supplier info
- Characterization data
- Cell cycling information
Manufacturing
- Component supplier information
- Cell chemistry
- Process parameters
- Cell cycling data
Data Connection
Once data is collected, the next challenge is connecting it. Can you trace a single cell from raw materials to final test results? Often, the answer is no.
Common Issue:
A cell might be labeled Cell_23-A-042 in the cycler file, 23A042 in one spreadsheet, 23-A-42 in another, and referred to differently in notes. Different teams use different naming conventions, and identifiers don't match across systems.
The Solution: Connecting data means creating a logical lineage—this cell came from this batch, which used this cathode supplier, went through this formation protocol, and showed these test results. It requires:
- Consistent naming conventions across all systems
- Unique identifiers that carry through every step
- Clear hierarchies (cell → batch → material lot → supplier)
With these connections in place, questions like "do cells from Supplier A degrade faster than Supplier B?" become straightforward to answer.
Analytics
Once data is collected and connected, teams need tools to analyze it. Many start with Excel or custom Python scripts. This works initially, but can lead to inconsistencies—for example, when different engineers calculate capacity fade using different methods, or when someone updates a formula in their local copy. Over time, it becomes unclear which calculations are current.
What a Robust Analytics Solution Provides:
- Standardized calculations so metrics like "capacity fade at 100 cycles" mean the same thing across teams
- Version-controlled data where everyone works from the same source
- Linked data so you can filter cycle performance by cell metadata in one view
- Flexible visualization that works for both technical deep-dives and management summaries
AI and Process Automation
Once clean, connected data is in place, AI and automation can begin to deliver value. With structured data, algorithms can detect patterns, predict which cells may fail early, and flag anomalies in real-time.
Key Insight: The quality of predictions depends directly on the quality of input data, which is why data collection and connection are foundational steps.
What this looks like in practice:
1. Quality Assurance
Quality is extremely important, particularly in the battery industry. Real-time data enable manufacturers to detect quality issues instantly. This can include operating anomalies with machines or performance anomalies with produced materials or cells. Data-driven quality control uses statistical process control and anomaly detection to identify and correct defects, ensuring consistent quality and reducing variability.
2. Predictive modeling of Cell Lifetimes
Collecting cell cycling data is the longest and most critical part of both R&D and cell quality control. Traditional cycle testing can take months before reaching end-of-life, delaying decisions about material quality, process settings, or suppliers. Data-driven models trained on early cycle features can accurately predict lifetime trends before a cell fails. These models can help teams identify outliers early, screen new chemistries faster, and reduce testing costs while maintaining confidence in long-term performance.
3. Digital twin and simulation-based optimization
Digital twin technology creates virtual replicas of physical cells, equipment, or full manufacturing lines, updated constantly with real-time data. In battery production, they allow teams to simulate process changes before implementing them on the line. By integrating physics-based models with live sensor data, engineers can predict outcomes, identify bottlenecks, and test "what if" scenarios safely in software. The result is faster optimization, fewer physical trials, and a continuous feedback loop to improve yield, consistency, and scalability.
Where does Micantis come in?
Hopefully this article has convinced you that data driven approaches are the key to scaling with speed and certainty, and the foundation of developing data driven approaches is good data. Yet for most teams, data lives across instruments, spreadsheets, and people making it hard to have process traceability. Micantis is designed specifically to help teams compile, canonicalize, and analyze their cell testing and metadata with customized graphing, automatic reporting, and tools built specifically for cell quality control.
Scaling fast and shipping confidently requires better data, not just faster testing — and Micantis gives you the tools to make every battery decision faster, clearer, and more confident.