

Results Analysis and Taguchi Parameters
Since the Micantis platform captures technical cell design information and pairs it with the test data for the cell, it can generate analyses that relate design characteristics with performance data with very little work from the user. By automating the process, it becomes feasible to check analysis results while the experiment is in progress and pivot if necessary. The Micantis platform can produce analyses of discrete experiments or any arbitrary cell grouping.
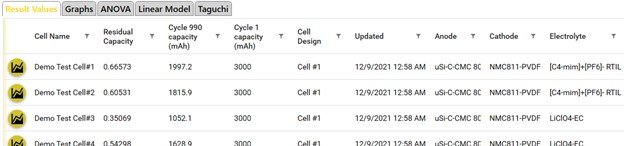
The analysis produces a table of result information, plots the relevant data, and calculates multi-way ANOVA, multiple linear regression, and standard Taguchi parameters. A growing list of analysis types are available, including cycles to failure, capacity retention, specific capacity, and others. Each analysis provides a single, scalar result metric for each cell that is used for the ANOVA and linear regression. It also provides auxiliary, supporting result data to make the calculations clear. These appear as extra columns in the results table, and in the graphical output.
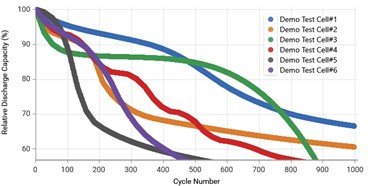
The first analysis output is an interactive table of cell properties with result values. This table alone can help with “simple” questions like “Which out of all the cells we’ve made has the highest capacity retention at N cycles?” or “Which cell from this experiment had the highest specific capacity?”.
A multi-way ANOVA is the next result in the analysis. The software uses the experiment’s control variables or compares the design data for an arbitrary cell grouping and reports mean effects and P-values for all the extracted variables, sorted by P-value. Since optimal DOEs implicitly have several tests for each variable value, they have a better chance at reporting significant effects.
The linear model provides more insight into variable interactions, effects, and the “paper champion”. The linear model solves the system where X is the DOE table, y is the vector of result values, and β ̂is a vector of the estimated effects for the control variables:

This system is simply the ordinary least-squares equation and reduces to a two-equation system for simple single variable linear fit (i.e. y = ax + b). The “paper champion” is a term sometimes used in the context of Taguchi methods to describe the mathematically predicted highest performing cell, where the linear model is used to predict performance for each design. It’s possible that the paper champion might not have been built yet, depending on the DOE. If that’s the case, that might be a good design to build and test.

Finally, for each control variable extracted from the experiment or cell grouping, the Taguchi results section provides signal-to-noise, mean, and standard deviation. Taguchi methods typically use only the signal-to-noise ratio as the figure of merit, but this metric can be confusing if the variance is not proportional to the mean.
By providing this analysis with minimal effort from the user, the Micantis platform allows users to run complex DOEs without the pain of manually typing results values into Excel or Minitab. It becomes trivial to check on experimental results while testing is still in progress. Engineers can spend more time thinking about the difficult problems, and less time wrestling with software and tedious workflows. The result is a better battery, faster.
References
Montgomery, D. C. (2017). Design and analysis of experiments. John Wiley & Sons.
NIST/SEMATECH e-Handbook of Statistical Methods, http://www.itl.nist.gov/div898/handbook/, 2020.